
Candlestick Patterns is a universal tool in the arsenal of crypto traders. Understanding how to read graphical patterns correctly allows traders to analyze market trends and make the best trading decisions that can bring profit.
The better you understand technical analysis, the more likely you will get the most out of the bullish and bearish trends. We strongly recommend combining candle pattern trading with trend line trading, so that one can use not only candle analysis in trading but also combine other methods of technical analysis.
In any case, let us examine the various basic candlestick analysis patterns that traders use and how to define them on the chart using examples. We hope that, by the end of this article, you will be able to identify graphic patterns like a professional.
What Are the Patterns in Trading?
Before moving on to the different types of trading patterns, we determine the candlesticks used in trading.
A candle in trading shows the price movement of a particular asset over a certain period. It shows the opening, maximum, minimum, and closing times for the selected timeframe. Usually, people trade based on 1-, 2-, and 4-hour timeframes or candlesticks, as well as daily, weekly, and monthly timeframes. However, all the patterns described in this article can also be applied to lower timeframes and candlesticks, such as 1, 15- and 30-minute ones. But one needs to be careful on such low timeframes, as the crypto market is very volatile.
Basic Concepts
Chart patterns are recurring geometric shapes in the price movements of digital currencies such as triangles, rectangles, and wedges. They offer a visual narrative of the market's price behavior, signaling bullish, bearish, or neutral sentiments. These patterns are based on probabilities and not certainties, and their effectiveness depends on various factors, including market conditions and timeframes.
Reversal Patterns
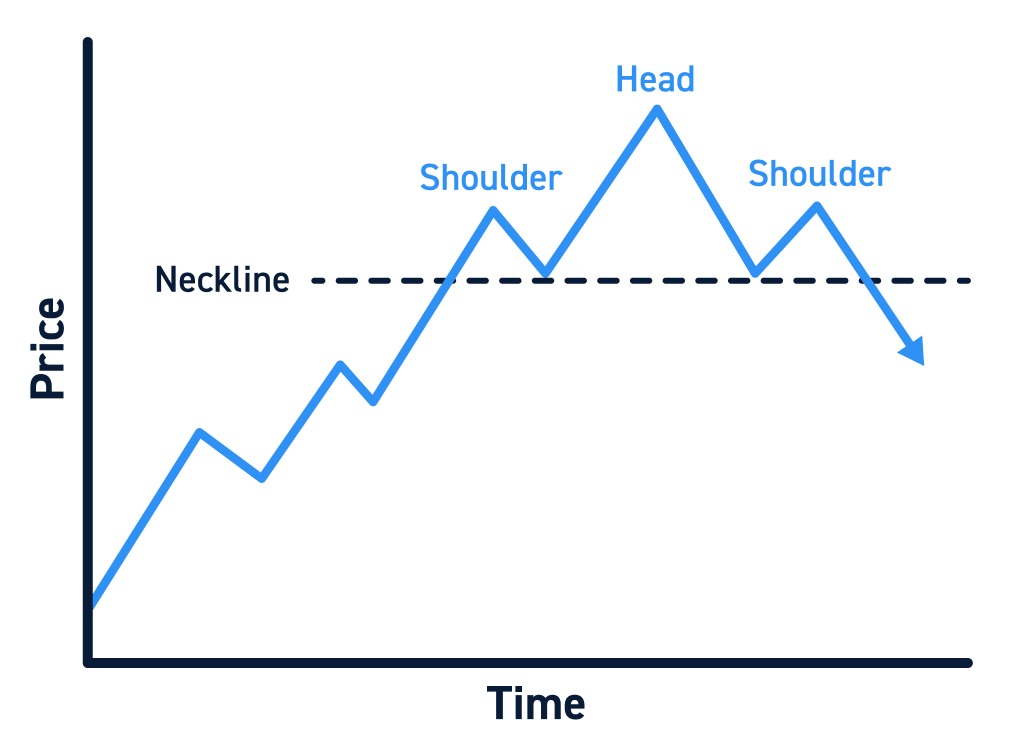
Head and shoulders
The pattern was considered to be worked out when the height of the right shoulder reached the height of the left shoulder. In the present case, the head and shoulders were inverted. The development of further movement formation depends on the timeframes in which the pattern is formed and can mean both a global and a local reversal.
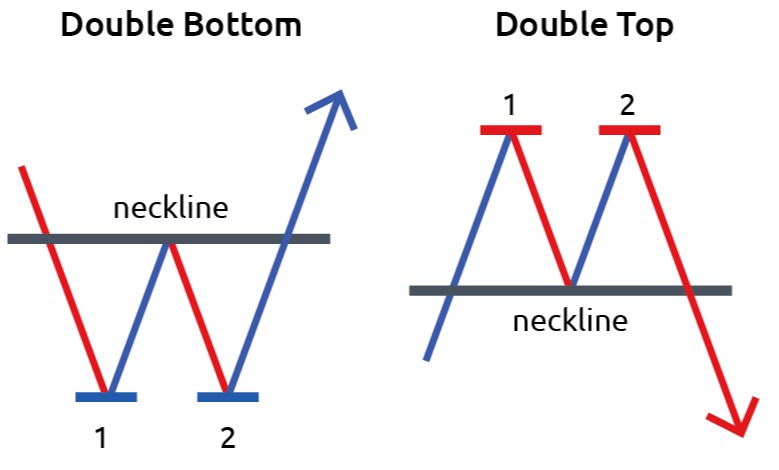
Double Top
A double vertex has the properties to go to its beginning, and it is important to understand that if it is a vertex, then the formation of its first line should begin along the trend from below; if it is formed from a flat state, this will not be a pattern, and the situation is similar to a double bottom.
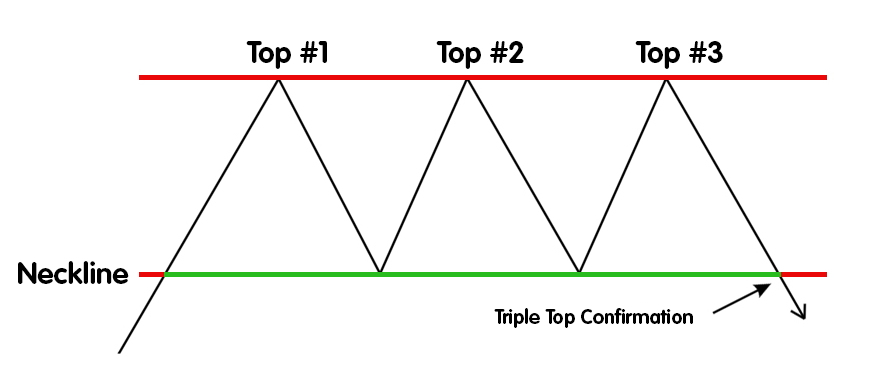
Triple Top
The pattern is similar in meaning to the "Double Top" pattern. It is much less common in smaller timeframes, but after seeing a similar structure, one can enter a position with long-term goals.
Continuation Patterns
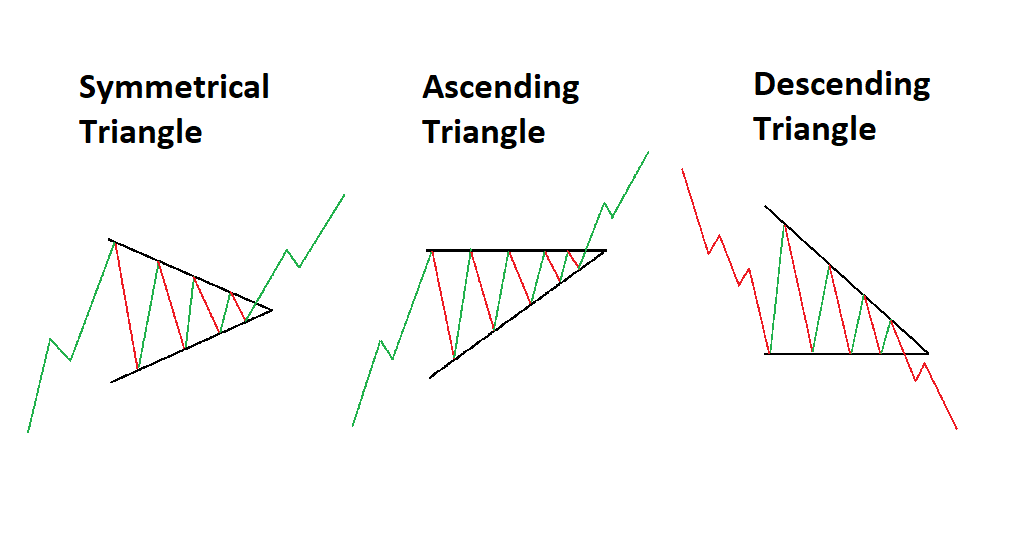
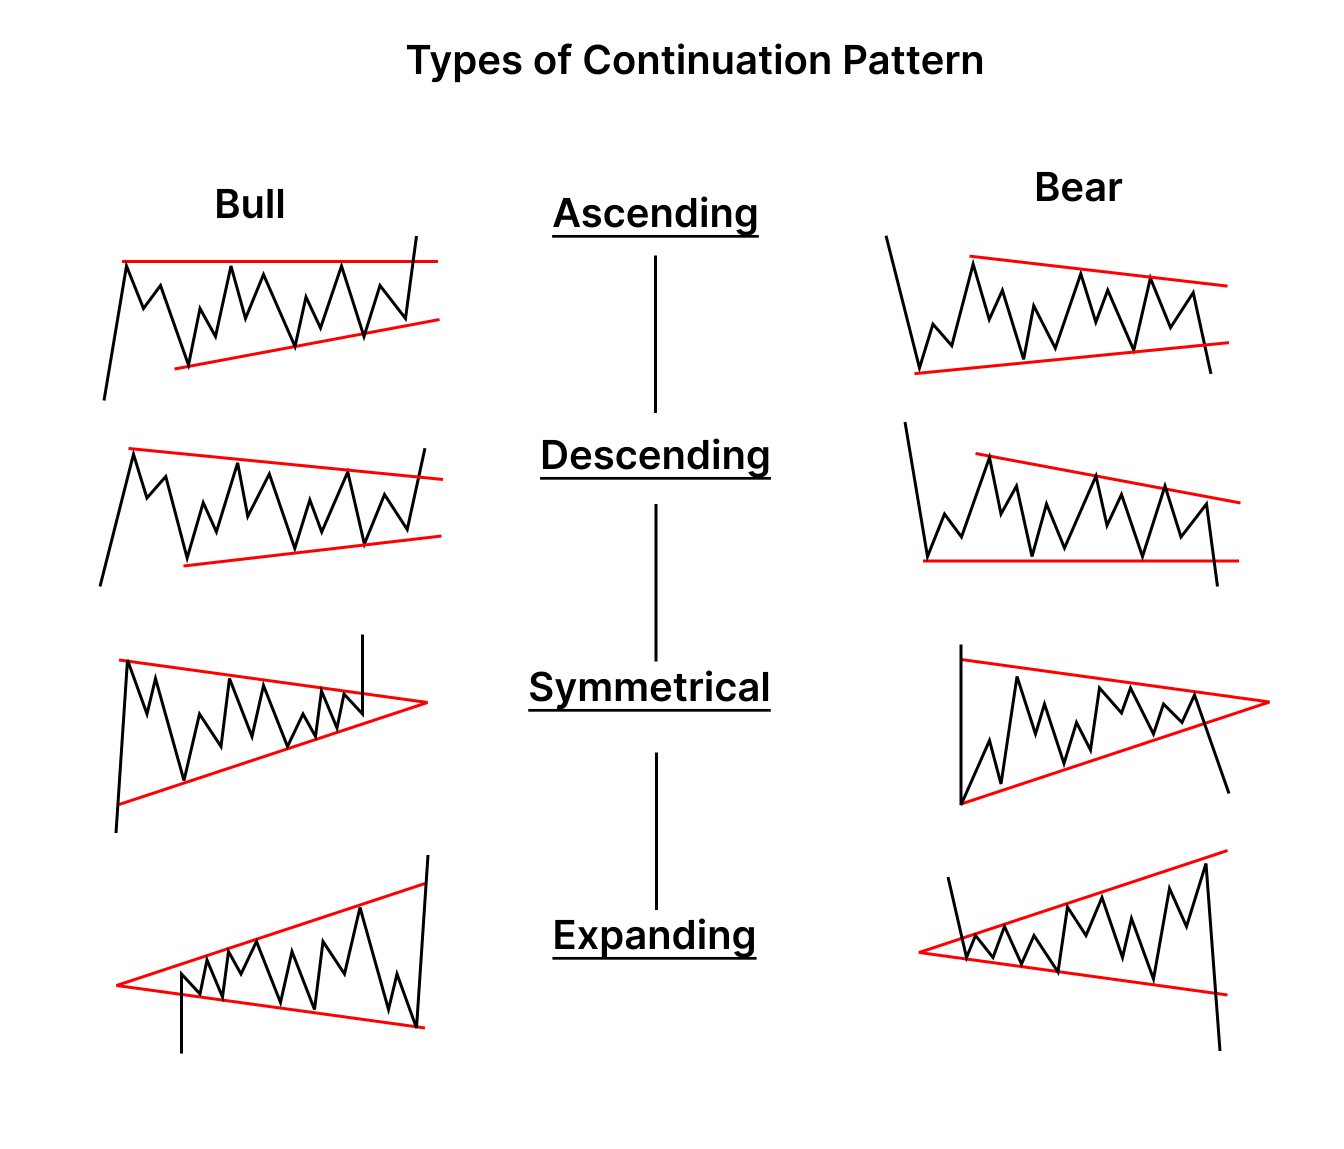
Triangle
This pattern is most often formed when there is uncertainty in the market. For example, the market waits for important news, which may change the trend. The volatility narrows, and the edges of a triangle are formed.
There are three types of patterns: symmetrical (or equilateral), ascending, and descending.
A divergent triangle is a symmetrical one. Its top is directed to the left, and the price moves along the edges with a gradual expansion of volatility.
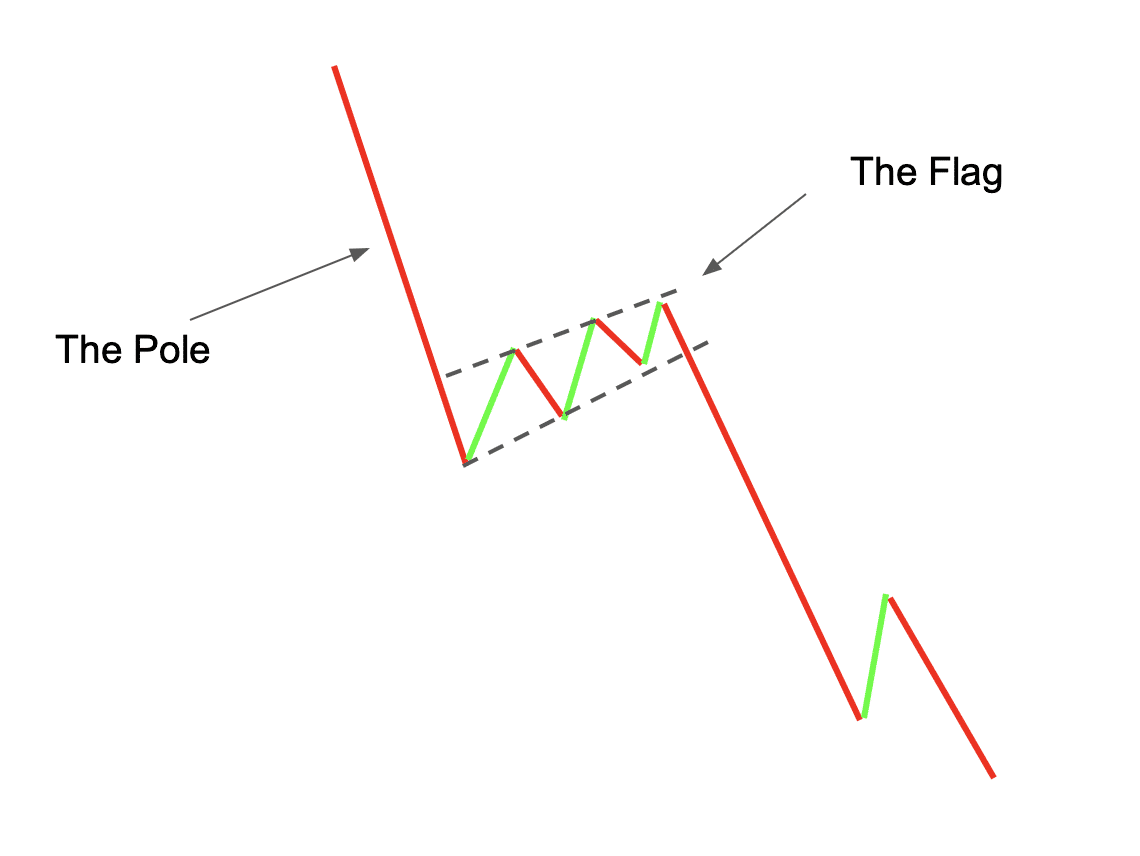
Flag
It is formed at the end of the first phase of growth or falls into two parallel lines. Visually, it appeared as a tilted rectangle. The height of the exit from the flag is approximately equal to the size of the flag.
In essence, it is an analog of the flag but is created at the end of the growth or fall phase in the form of a triangle.
Trend continuation patterns
As the name implies, such technical analysis figures signal the continuation of the prevailing trend. The most important component of such patterns is the consolidation period when the price moves within a relatively narrow or gradually narrowing range.
Against the background of such figures, something like respite takes place in the market. This trend continues after the price breaks through the trading range.
Trend continuation patterns include modifications to triangles, wedges, and pennants.
Recall that the wedge can be considered both as a reversal pattern and a trend continuation figure (depending on the trend preceding this figure).
Practical Tips for Traders
Stay calm and avoid pressure
Do not start trading if the optimal conditions for making the right decisions do not currently exist. For each trade, you must have a trading plan that implies an understanding of the levels and conditions under which the deal will be closed. Any additional pressure negatively affects trading performance. Never rush! If the opportunity to enter is missed, wait for the next one, and get it.
Set goals and place sell orders
Setting Goals and Placing Sell Orders: Always set their goals by placing sell orders. You cannot know exactly when the whales decide to pump your coin to clear the order book (and pay fewer commissions than the makers).
Place purchase orders below current prices
A successful trading strategy also involves placing purchase orders below current prices. On the Poloniex exchange in December 2016, there was a sudden collapse in the Augur price, which fell by 75%, and after a while, the market fully recovered. Traders who were not too lazy to place orders at the very bottom of the chart were able to easily double or triple their investments.
However, placing such an order requires special care. You should constantly monitor the situation so as not to get into a real sale when the price continues to decline after your purchase order is triggered.
Buy on rumors – sell on news
When reputable publications release news concerning coins in which you currently have active transactions, it may be the opportune moment to bid farewell to those assets.
What to do with lost profits?
The usual situation is that you close a profitable deal, but you sell, and the coin soars up again. What to do?
First, get to know Murphy's law. Nothing is as easy as it looks. Everything takes longer than you think. Anything that can go wrong will go wrong.
Second, never open a deal under pressure and do not pursue already missed opportunities. You have recorded a profit, which means that everything is just fine. Stick your trading strategy and look for a new entry point.
And, of course, always do your own research (DYOR) and do not just follow the mood of the volatile crypto market.
Conclusion
Identifying trend continuation patterns is time-consuming. Finding patterns is not an exact science, and many traders see different patterns on the same charts. However, the more you work with technical analysis figures, the easier it will be to find them.
Chart patterns are valuable tools for crypto traders, offering insights into potential market movements, and helping traders make informed decisions. However, it is important to consider various factors that can affect the effectiveness and reliability of chart patterns in the crypto market. By understanding and utilizing these patterns effectively, traders can enhance their trading strategies and improve their overall success rate.
Related posts